Data-driven product development: a practical guide

What’s in this article
- Key takeaways
- What are the common pain points product management teams face without good data?
- How do qualitative and quantitative data work together?
- How do you build a product backlog prioritization framework?
- How do you close the feedback loop without manual work?
- What does this look like in practice?
- Is data-driven product management always better than trusting your gut?
- What does the future of product management look like?
- FAQ
Data-driven product development is a way of building products where real evidence from users guides what you build next. Its main advantage is that it replaces guesswork and the loudest opinion in the room with decisions your whole team can trust.
Key takeaways
- Data-driven product development means letting patterns in user feedback and behavior, not gut feeling alone, drive your roadmap.
- The hardest problem is usually not too little feedback. It is feedback scattered across five separate tools that never gets connected.
- Weigh requests by how many users are affected, not by who complains the loudest or who pays the most.
- Pair quantitative analytics (what happened) with visual feedback (why it happened) to see the full picture.
- Being data-informed, combining evidence with product judgment, is often stronger than being rigidly data-driven, especially early on when data is thin.
It sounds obvious in principle: use evidence, not hunches. In practice, data-driven product development is harder than it looks, because most teams are not short on feedback. They are buried in it: NPS scores with no context, vague one-liners like “too confusing,” support tickets that never reach the product team, and feedback spread across tools and threads. This guide walks through how to turn that noise into decisions you can actually ship, whether you are a product manager, a developer, or a founder wearing every hat at once.
What are the common pain points product management teams face without good data?
The core problem is rarely a lack of ideas. As one product manager put it, the real struggle is deciding which features to build and in what order. Most pain points product management teams run into come down to the same thing: no clear system for turning feedback into decisions. Without one, a few predictable failure patterns take over.
The loudest customer wins
When a single vocal customer or an important stakeholder pushes hard, their request can jump the queue, even if only one person actually wants it. Listening to the loudest noise gives you individual requests, not trends. The fix is to check whether many users share the same problem before you commit engineering time to a hand-weaved feature.
Feedback lives in five different places
Product teams take input from support tickets, emails, sales calls, in-app messages, and direct research. But when it comes to organizing it, most still fall back on spreadsheets, docs, and note apps. The result: the same insight gets rediscovered again and again, and nobody can see that ten customers asked for the same thing across four separate channels. This is where a repeatable feedback triage process, sorting and tagging incoming reports before they pile up, saves a team from itself.
Drowning in data, unable to decide
The opposite problem is just as real. Teams with plenty of dashboards can hit analysis paralysis: conflicting metrics, endless “wait for the A/B test” discussions, and so much data that no decision feels safe. As Andrew Chen writes, you can have too much of a good thing, and eventually the highest-paid person just decides anyway, which is where you started. The goal is not more data. It is the right data, tied to a clear decision.
Sometimes the data simply is not there
Especially for a brand-new product or feature, you may stare at blank dashboards because nothing is instrumented yet. That is normal. When you are building a version one, you often have no history to work with, so early decisions lean on informed judgment. Data flows in later, and from version two onward it can take the lead.
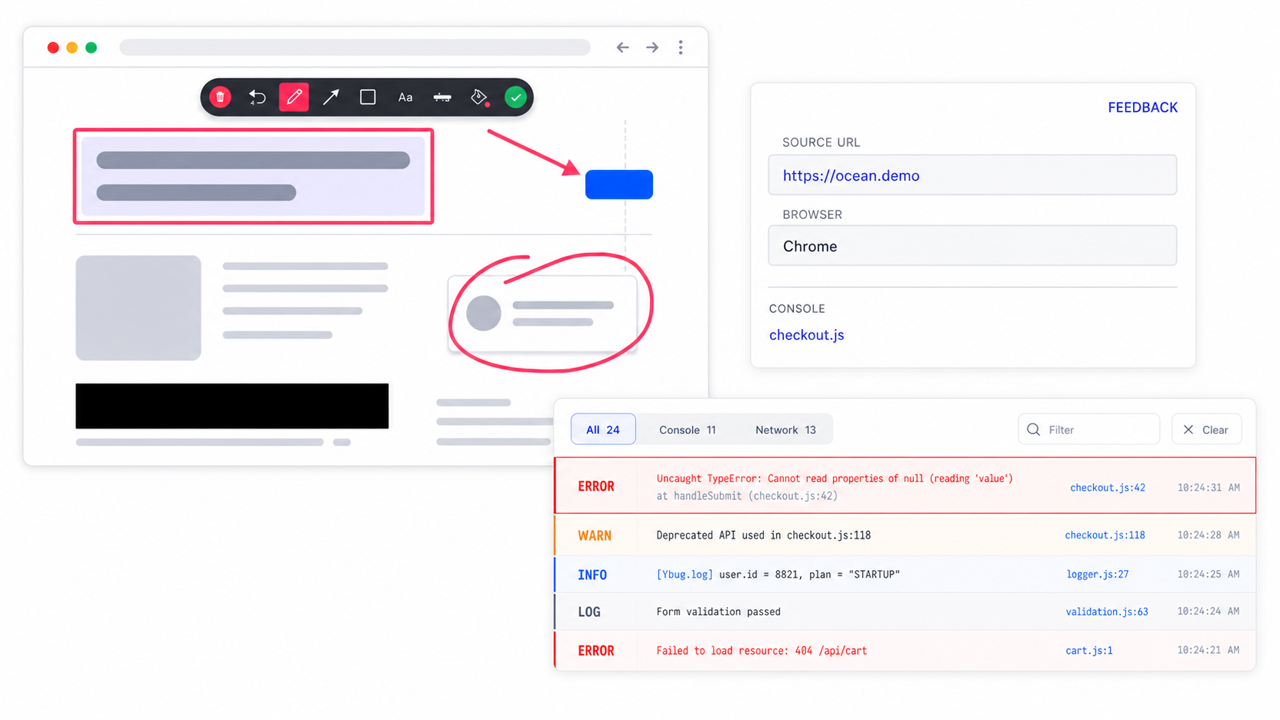
We have seen this firsthand: teams that switch on visual feedback on their live site tell us the biggest change is not volume, it is context. A screenshot with the exact page, browser, and console log attached turns a vague “it is broken” into a report a developer can act on without a single follow-up email.
If chasing missing details across scattered tools sounds familiar, this is exactly the gap a website feedback tool built for SaaS teams is meant to close.
Capture screenshots and technical context automatically, so every report arrives ready to act on.
(no credit card needed)
How do qualitative and quantitative data work together?
They answer two different questions, and you need both. Quantitative product analytics tools like Mixpanel, Amplitude, or PostHog tell you what happened: for example, 40% of users drop off on step two of your signup. What they rarely tell you is why.
That is where qualitative, visual feedback fills the gap. A screenshot annotation tool shows you that the submit button is hidden behind a cookie banner on mobile, or that the console is throwing a JavaScript error at exactly that step. The numbers point you to the problem area; the visual context tells you the cause. Run them side by side and prioritization stops being guesswork.
How do you build a product backlog prioritization framework?
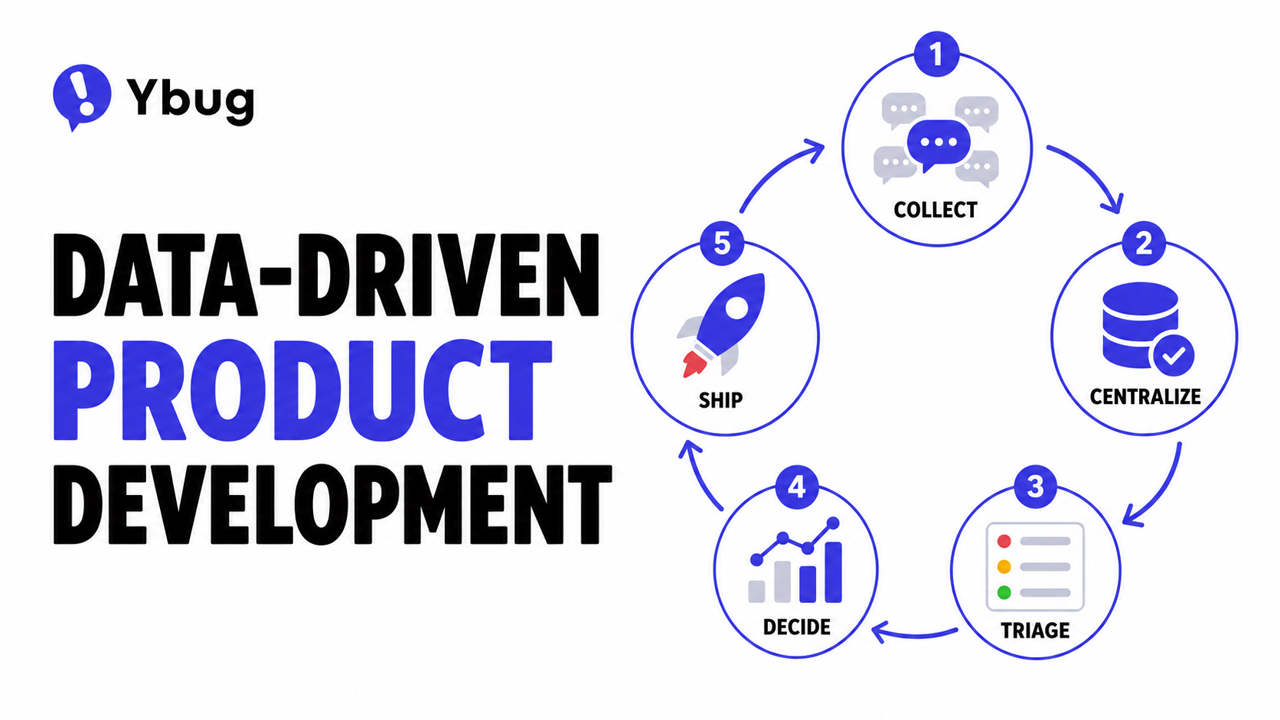
A workable process does not need enterprise tooling. It needs a repeatable loop that turns scattered input into a ranked backlog. Here is a five-step version that scales from a solo founder to a full product team, and helps you balance new feature requests against technical debt instead of letting one crowd out the other.
- Collect from everywhere. Pull feedback from support, in-app widgets, reviews, and sales into one flow instead of leaving it in silos.
- Centralize it. Route everything into a single place so a request that arrives three times is visible as one pattern, not three orphans.
- Triage and spot patterns. Tag and group similar requests, so you can see that a problem hitting 80% of users outranks one that hits 2%.
- Score and decide. Use a simple framework so ranking is not a personality contest.
- Close the loop. Tell the people who asked when you ship it. This is what turns a one-off report into an ongoing relationship.
Which scoring framework should you use?
You do not have to invent one. The RICE framework, created by the product team at Intercom, scores each idea by Reach, Impact, Confidence, and Effort using this formula:
RICE Score = (Reach × Impact × Confidence) / Effort
It combines four rough estimates into one comparable number, so ideas compete on measurable value rather than on who argued hardest. It is not a hard rule, and you will sometimes work out of order for dependencies or table-stakes features, but it makes those trade-offs visible instead of hidden. For a plain-language walkthrough, Product School has a good explainer on RICE.
RICE in practice: why context decides
Imagine choosing between two requests:
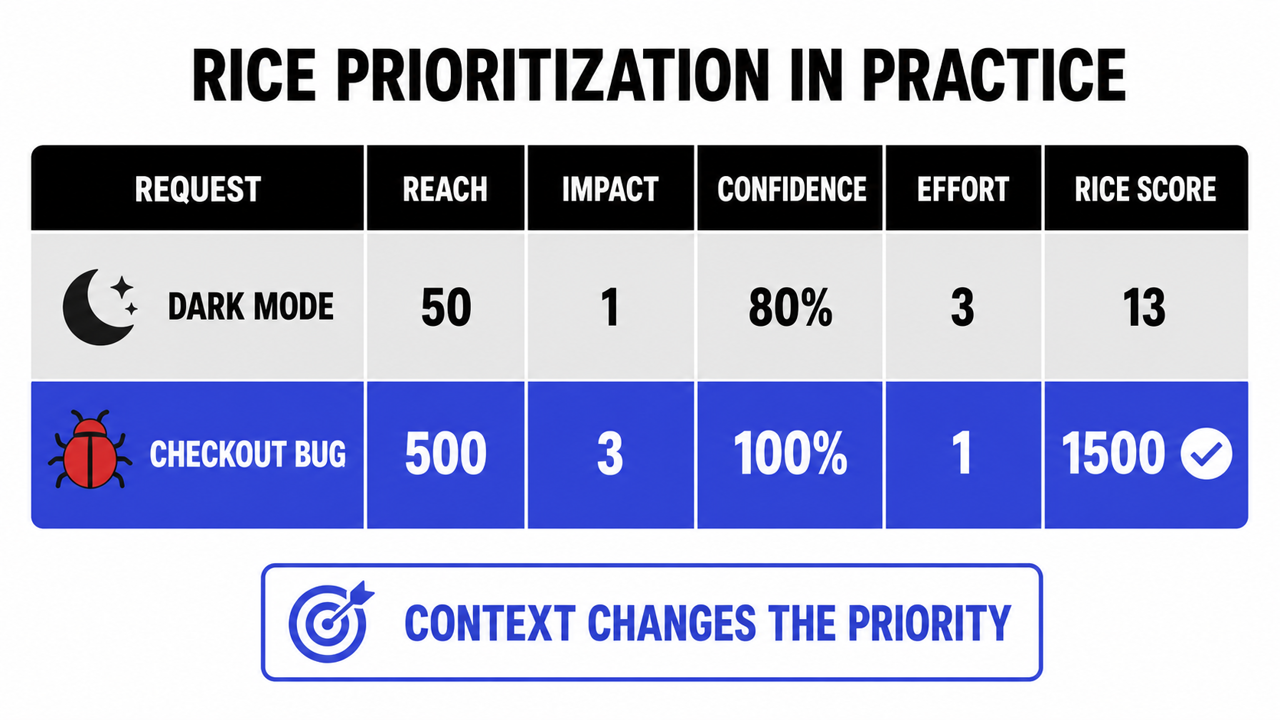
Request A (dark mode): 50 users ask for it on a forum. Reach 50, Impact 1, Confidence 80%, Effort 3. RICE score: about 13.
Request B (checkout bug): reported only 3 times through Ybug, but the attached console log shows it blocks 15% of payments on Safari. Reach 500, Impact 3, Confidence 100%, Effort 1. RICE score: 1500.
Without the technical context from the visual widget, Request B would look like “an occasional complaint from 3 people” and dark mode would win. The context raises Confidence and lowers estimated Effort, and the real priority becomes obvious.
Here is the practical part most guides skip: your scores are only as good as your inputs. “Reach” means nothing if you cannot see that the same request came from ten accounts. That is why the collect and centralize steps matter more than the math. A clean product development feedback pipeline is what makes the scoring trustworthy.
How do you close the feedback loop without manual work?
Closing the loop, telling users you shipped what they asked for, is the step most teams skip because it feels like admin. The trick is to automate it. Route reports straight into your issue trackers through the integrations you already use, so a Ybug report becomes a Linear, Jira, or GitHub issue with the screenshot and context attached. Then let the tracker do the follow-up: a status change to “Done” can trigger an automatic email to the reporter, a public roadmap can flip the item to “Shipped,” or your release notes can credit the request. No spreadsheet chasing required.
What does this look like in practice?
Say you run a small SaaS app. A customer reports that a form breaks on checkout. Instead of a one-line email, they click a widget, draw on the exact field, and submit. Ybug attaches the screenshot, the URL, the browser, and the console log automatically, then creates a Linear issue for it. That report lands next to two similar ones from last week. Suddenly it is not a hunch that checkout is fragile, it is a pattern with three data points and full context, ready to score and fix. When it ships, Linear marks it Done and the reporter gets a note back.
The teams that win are not the ones drowning in feedback. They are the ones who make every piece of feedback easy to act on. When a report already carries the screenshot, the page, and the browser details, deciding what to fix next stops being a debate and starts being obvious.
Is data-driven product management always better than trusting your gut?
No, and this is where a lot of teams get it wrong. Data-driven product management does not mean ignoring judgment. There are really three ways teams make product decisions, and the healthiest sits in the middle:
| Approach | What drives it | Main advantage | Risk |
|---|---|---|---|
| Gut-driven | Intuition, the loudest customer, or the CEO | Fast, needs no data | Building features nobody else wants |
| Data-driven | Hard metrics and A/B tests only | Objectivity, removes guesswork | Analysis paralysis, optimizing the past |
| Data-informed | Data plus product judgment and vision | Balance, long-term strategy | Needs experienced product leadership |
Many experienced product leaders argue that rigid data-driven decision-making is actually weaker than being data-informed. If you only regurgitate the numbers everyone else can see, you have no edge. Data tells you what happened; judgment helps you decide what to do about it.
There are real limits to leaning on data alone. You can end up measuring yesterday instead of tomorrow, chasing what your current niche audience wants while a broader market drifts away. Correlation gets mistaken for causation. Some of the most important things, long-term brand or a strategic partnership, barely show up in a dashboard at all. The healthy middle ground: optimize the things worth optimizing with data, and use judgment for the big, early, or fuzzy calls where the data cannot help yet.
What does the future of product management look like?
The future of product management points in one clear direction: less time spent gathering and cleaning feedback, more time spent acting on it. AI is already helping teams summarize themes across thousands of messages, but the input still has to be good. Garbage in, garbage out has never been more true. Teams that capture rich, contextual feedback at the source, with the screenshot and the environment attached, will feed better signals into whatever analysis comes next.
For project and product managers specifically, the shift is toward a single, trustworthy source of truth. If you are exploring this, a feedback tool for project managers that captures context automatically removes most of the manual triage that eats your week.
For a deeper look at how to collect user feedback for your product roadmap, see our guide on voice of the customer.
Ready to feed better signals into every product decision? Start collecting clear, contextual feedback in minutes.
Turn contextual feedback into clearer product priorities and faster decisions.
(no credit card needed)